JTFA (Joint Time x Frequency Signal Analysis) is a a class of mathematical transforms which maps a one-dimensional signal to a two-dimensional display of energy versus time and frequency. For an introduction to JTFA, see "Linear and Quadratic Time-Frequency Signal Representations", IEEE Signal Processing Magazine, Vol. 9, No. 2, April 1992.
What a time-frequency analysis shows depends largely on the transform used. The simplest transform (and the easiest to compute) is the Short Time Fourier Transform (STFT). The compute the STFT, the signal is multiplied by a weighting window to minimize spectral leakage, the Fast Fourier Transform (FFT) algorithm is applied, and the modulus of the complex vector is computed. Then the window is slided and the computation done again. The result may be displayed on a 3D graph or a so-called 2D 1/2 representation (the energy is mapped to light intensity or color values), as below:
This kind of representation is called a "sonagram" and has been widely used for speech analysis, even before the availability of digital analyzers. The original Kayes(tm) sonagraph draws such a picture on a paper using a rotating drum and a sliding analogic narrowband filter. Today, this is easily acheived in a few seconds on a typical micro-computer.
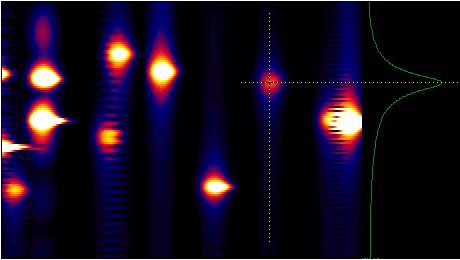
The Fourier transform suffers from an inherent coupling between time and frequency resolutions (increasing the first decreases the second, and vice-versa). Other transforms may be used to estimate more precisely the energy in a given FxT domain, for example:
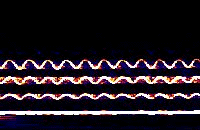
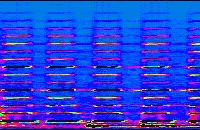
Applications of JTFA in the research field as well as in the industry are numerous, including speech analysis, telecommunications, underwater acoustics, bioacoustics, geophysics, structural analysis and so on... Below are two samples of music analysis using STFT:
Left: the vibrato of an opera singer. Right: five saxophone notes. Note the harmonics.